Sneak Preview: Custom Map Layers in Cluey

To kick off your weekend with some exciting news, we're thrilled to give you a sneak preview of a brand-new Cluey feature: Custom Map Layers!

Why Custom Map Layers?

To enhance orientation and decision-making in the field. You can see the boundaries of ranches and protected areas, locate ranger stations, monitor water points, and much more - all at a glance!

What's New?

You can load custom map layers directly from your phone into Cluey. Use the existing base map icon to select or deselect the layers you want to view.

Streamlined Navigation

We’ve also moved the menu to the bottom of the screen for easier access. Switching between your observations, groups, and other options is now smoother than ever.

When's It Coming?

This update will become available in September.

Have a great weekend!

Real-time HWC Risk Radars for Bears

We are shifting from a world where wildlife is restricted to nature reserves to one where we share our spaces with them. Many designated nature reserves are now too small to sustain healthy wildlife populations, so animals are increasingly venturing into human-dominated areas. This overlap can lead to dangerous encounters, risking harm to both people and wildlife. While humans have coexisted with wildlife for centuries, many traditional practices for safe interactions have been lost. Today, we have advanced tools to help prevent conflicts and ensure safer human-wildlife coexistence.

Wageningen University, in collaboration with Sensing Clues and other Nature FIRST partners, is developing a real-time Risk Radar for Bears. Similar to weather radars predicting rain, our human-bear-conflict radar identifies areas at high risk of bear encounters.

The Bear HWC Radar aims to provide timely risk information, helping people take preventive measures and avoid conflicts. We use a data-driven approach that combines scientific and heuristic bear knowledge, open-source land cover data, and local records of bear activity and conflicts to ensure our assessments are accurate and current.

The schemas below illustrate the steps taken to create the Bear HWC Risk Radar. The HWC Bear Radar's first live demonstration will be at the Eco Bear Fest in Tusnad in October 2024.

Join the Premiere about Elephants and Bees!

PREMIERE "DATA-DRIVEN SOLUTIONS: A STORY ABOUT ELEPHANTS AND BEES"

I'm thrilled to announce the premiere, featuring our Field Partner Wild Survivors!

They are a pioneering organisation, working with local communities to prevent human-elephant conflicts. Thus contributing to the survival of this grand species!@Judith is conducting the interview  

WHEN: Thursday 8 August, at 10 AM CET

Charcoal risk model hackathon

Our Sensing Clues colleagues, Melanie and Chiel organised a hackathon together with Big Data Republic from the Netherlands. The hackathon took place on two afternoons, on 19th and 26th January 2024.

The goal of the hackathon

The goal of the hackathon was to improve the risk model that was previously developed by Melanie and use new data that was available to make it better in predicting where illegal charcoaling events will happen.

Illegal charcoaling events are one of the main causes of environmental and biodiversity loss, especially in Africa, where charcoaling events are very widespread. Charcoaling is simply defined as the process of converting wood or woody biomass from bushes into charcoal through controlled burning and carbonisation. For this hackathon, we collaborated with Wildlife Works, our field partner in Kenya, to develop and test the charcoal event prediction model.

The participants of the hackathon

Four teams with 4 members participated in the hackathon, of which one would be selected as Winner! The teams were free to use other methods, models, and data sources (e.g. include Lidar data), and bring their creativity to the hackathon. In the end, the models were run against actual data from Wildlife Works, and the outcomes were compared with the base model we had developed earlier.

we had A winner. guess who it was!

From the graph, Team 2 (green) developed a significantly improved model compared to the base model (in red), as shown by the green curve. However, Team 4’s model (light blue) scored better on the left side of the graph which proved to be more relevant (explained below). Hence Team 4 emerged as the winners.

The winners didn’t go empty-handed

The winners were given some branded Sensing Clues beanies and also given an opportunity to have a meeting with Wildlife Works to understand how the risk model is being used in their daily work.


What we will do with the models

As for the models created during the hackathon, we will study the different approaches of the teams and will implement any ideas that improve the performance of the model, including ideas from the teams that did not win. This will help us develop an improved risk map of charcoaling events in the area.

The impact of the hackathon

The charcoal risk model helps to find more kilns against less patrolling efforts. The risk model makes predictions, and in doing so, it always makes two types of errors: False Negatives (FN) and False Positives (FP). False Negatives occur when we miss a charcoaling event happening in the area. False Positives occur when there is unnecessary patrolling in areas where charcoaling events have not taken place. The objective of the improved charcoaling model is to lower both errors, thus increasing patrol efficiency.

By taking into account the prevalence (rate of occurrence) of charcoaling, which is estimated at 2% of all areas, it is possible to express the potential of a classification model for charcoaling in an overall cost amount. This is shown in the graph above, where the straight lines indicate 'equal cost'; lines more to the left have lower overall cost.

As we want to avoid false negatives (missed events) more than we want to minimise patrolling places where no events are happening (false positives), the model of Team 4 came out as winner.

How New Relic is used to monitor our platform

Is is very important that our tools are available 24/7 and we can pro-actively react on potential issues. To ensure the availability of our solution is high, we use the monitoring tool-suite from New Relic. Not only can we use their application for free, they also support us with their Pro-bono program. Once or twice a year, they create a team to assist us and ensure we use their products the best way possible.

More about New Relic and how we monitor our platform can you read here: https://newrelic.com/blog/how-to-relic/sensing-clues-ngo-alerts-dashboards

The crane migration is on!

Author: ass. prof. Koen de Koning, partner in Nature FIRST

Autumn is normally marked by colder weather, giving many thousands of birds the go-ahead to migrate south to their wintering grounds in southern Europe and Africa. However, this fall has been particularly mild so far, so few birds really felt the need to begin their fall migration. That is now changing! Colder weather is approaching, and that will change the minds of many thousands of migratory birds. There may even be a real mass migration in the offing! So are the cranes.


Some time ago I examined GPS data from transmittered cranes, and combined it with historical weather data, to get a picture of how the weather affects their migratory behavior. What emerged? Cranes are particularly heavily influenced by weather in the fall. They wait patiently until optimal conditions literally give them a boost to fly southward. A very strong relationship can be found between a few key weather characteristics, and the choice to depart, namely: wind speed, wind direction, precipitation, cloud cover and temperature. The day of departure is heralded by a strongly cooling temperature, a substantial decrease in wind speed (calm weather), drier weather, more sun and a wind turning northeast. Sunshine provides the necessary thermals, allowing cranes to gain altitude easily, and the wind from the northeast naturally blows the birds south. Especially in northwestern Europe, where headwinds (southwestern wind) are dominant, this turning of the wind to the northeast is a very important starting signal for the autumn migration. And let now coincidentally all these favorable weather factors come together early next week! So that is a guarantee for spectacular bird migration!

Can we expect thousands of cranes in the Netherlands? That remains to be seen, but the predictions are favorable. The only thing is that most of the cranes have only just made the crossing from Scandinavia to Germany, so the question is whether they have been sufficiently 'refueled' to make the next leg. In addition, the wind has to come in from the east to 'blow' the cranes to our country. In any case, there is plenty of reason to keep a close eye on the crane radar!

And a nice piece of news for those who are already familiar with the crane radar: Recently, we have been working hard on a new version that incorporates all of these weather forecasts as well in order to track migration even more accurately on the radar!


Credits:

Nature FIRST and Waarneming.nl

Digital twins. An interview with Koen de Koning

Dr. Koen de Koning

To prevent biodiversity loss, we need information about endangered species: where they live and how they move. In other words, we need data about habitat areas and migration routes. But how can one accurately track wild animals? Current monitoring tools can only provide information at one point in time, or at best on trends in the recent past. And for high quality tracking real-time data is needed. The solution is Digital Twin models. They combine prediction models with real-time data, and are widely used in engineering and construction. We talked to dr.ir. Koen de Koning, the author of the idea to apply Digital Twins in nature conservation, and developer of the first Digital Twin for biodiversity, the Crane Radar, on how it was developed and what are the challenges of being early adopters of this technology.

Nature FIRST is the first project to apply Digital Twin modelling to nature conservation. "It is a big challenge. But as a scientist, I can say it is exciting to be the first, come up and work on solutions that can help us better monitor nature and use technology for good," says Koen.

Digital Twins have already proven to be effective in various industries, from manufacturing to healthcare. It originated in the field of space engineering, and is still widely used by space agencies. The main feature of Digital Twins is that they work with real-time data and predictions based on scientific and expert knowledge. In contrast, general models are static and provide only snapshots of a condition at one point of time. "One of our challenges is to make sure there is no misunderstanding of the concept," highlights Koen. 

At Nature FIRST, the team that works on the development of Digital Twins consists of experts from various fields. "The advantage of the Nature FIRST consortium is a combination of expertise from different fields. In the team, we have ecologists who can explain processes in ecosystems, and software developers who can build real applications. This is exactly what's needed to properly build Digital Twins," says Koen.

The Crane Radar is the first version of a Digital Twin developed within Nature FIRST. It monitors migration routes of the cranes in the Netherlands, Germany, Belgium, Luxembourg  and France. "It started as a hobby of mine, I always liked observing birds, and cranes in particular. To see them, you need to be in the right place at the right time. Somehow I always missed it, and to solve this problem, I came up with an idea to create a Digital Twin for monitoring the cranes," shares Koen. 

Migration of the cranes has become the perfect starting material for building a Digital Twin as it has essential elements. Firstly, the direction of the routes is straightforward and easy to predict. The cranes are migrating from north-east to south-west in autumn, and south-west to north-east in spring. Secondly, birders report their crane observations on an online platform about location, time, and flight direction, which can be used for prediction. Being combined with wind predictions and flight prediction models, it creates a Digital Twin with real-time updates on where the cranes are flying. 

The Crane Radar can be easily accessed by anyone. You can record your own observations at Waarneming.nl as soon as you see a crane flying. As soon as it gets uploaded, you can be sure you have improved the prediction. The application is updated every minute for each group of migrating cranes. Of course, the application becomes active only during migration periods.

The Crane Radar developed by Nature FIRST can be further used in other regions. “One of the objectives of the Nature FIRST project is to identify what is necessary for scaling up Digital Twins,” says Koen. As for other species, the Digital Twin for the cranes can be easily adapted to monitor the sturgeon in the Danube river, one of the target species of the Nature FIRST project. “General rules to create a Digital Twin model for species in the state of migration are the same,” explains Koen. However, to monitor large carnivores such as wolves and bears, the research team will develop new types of Digital Twins. 

What are the main challenges?

Being the first adapter of Digital Twins in biodiversity preservation, Nature FIRST faces a few challenges. Firstly, it is the need to agree on a common definition of Digital Twins as a combination of prediction models and real-time data. Also, interdisciplinary cooperation is needed. "We are still learning how to build Digital Twins, and we can do so thanks to the experience of our colleagues from other fields," says Koen. 

In addition, policy makers need to understand limitations of Digital Twins. They can be used for the purposes they were built for. For example, the Crane Radar can only be used for monitoring the crane's migrations. Digital Twins mimic the natural processes, but they are still simplified models of reality and do not fully resemble every process. If explained adequately, the data provided by Digital Twins can help to make well-informed decisions to prevent biodiversity loss. 

WWF-Ukraine introduces Sensing Clues

In May, our WWF-Ukraine colleagues of Nature FIRST have trained staff of the Verkhovyna National Nature Park and Yasinya Forestry in collecting and analysing data about large carnivores.

Some impressions!

It is necessary to systematically collect and analyse information on the populations of large carnivores and other species to develop sustainable management plans for territories, biodiversity conservation, and the prevention of conflicts in the region. The modern tools of the Sensing Clues software suite can provide this. We provided partners with 10 test smartphones with ready-to-use mobile applications and installed these applications on employees' phones. We introduced and taught how to work with the capabilities of the package of programs for monitoring and analysis, — Roman Cherepanyn, WWF-Ukraine expert and project manager.

"We met motivated conservationists who strive to improve the primary data collection process and modernise their analysis on these training. We got reasonable questions and collected comments and suggestions regarding work organisation with the presented mobile application. Today, this package of programs for analysis and reporting has no available analogues; it has received favourable reviews", — Ostap Reshetylo, WWF-Ukraine expert and project manager.

Intro and Demo of Solutions for Biodiversity Monitoring

Join our online demo

Join an online session where we will showcase the achievements, solutions, and technologies of Nature FIRST, a project focused on biodiversity preservation. Our goal is to gather feedback from key stakeholders in the ecosystem, as they are the future users of our technology.
The session will begin with an introduction to the project, followed by a demonstration of our achievements and solutions.

After the demonstrations, we will open the floor to a Q&A session where you can ask questions and provide feedback. We hope to start a discussion about the ongoing challenges in biodiversity preservation and gather insights from key players in the field.
The session will take place on April 26, 14:00 CET. We look forward to your participation and contribution to this vital discussion. Please let us know if you can join by completing the form below. After completing the form, you will receive a link for the session!


Agenda (CET)

14:00 – 14:10

Introduction of Nature FIRST by Jan Kees from Sensing Clues

14:10 – 14:45

Nature FIRST tech & solutions demonstrations

  • Taxonomy crossovers: EUNIS, CLC, IUCN Red List, Natura2000 and more by Albin from the Semantic Web Company

  • Ecosystem base maps by Melanie from Sensing Clues

  • Intro to the Habitat Mapping method by Jan-Kees from Sensing Clues

  • TrapTagger for Species Recognition by Judith from Sensing Clues

  • Towards the Nature FIRST Knowledge Graph by Jan Kees

14:45 – 15:00

Q&A


About Nature FIRST

As a Horizon Europe project funded by the European Commission, Nature FIRST is developing predictive, proactive, and preventative tools for nature conservation.

Stay tuned to learn more about how we combine forensic intelligence, remote sensing technologies and digital twins to protect and restore biodiversity in Europe and beyond. The tools we are developing are tested and demonstrated in the following regions:

  • The Carpathian Mountains, a 1,500 km-long range in Central and Eastern Europe.

  • The Danube Delta River is Europe’s largest remaining natural wetland. The more significant part of the Danube Delta lies in Romania, and a small part is in Ukraine.

  • The Stara Planina Mountains are a mountain range in the eastern part of the Balkan Peninsula.

  • And the Ancares y O Courel, the largest green reserve in Galicia, Spain.

Learn more about the project on the Nature FIRST website.

Cluey version 3.0 - Community Work

Cluey is being used in a rapidly growing number of countries across the globe to record data related to biodiversity, human-wildlife conflicts, (illegal) human activities, and related points of interest. Next to these themes, most (if not all) projects are deeply engaged with local communities.

To accommodate the needs of these and future projects and to facilitate the collection of data related to community work, we carried through a series of upgrades. In this email you read all about them.


Community work
Cluey now supports the registration of activities conducted for and with the local community. The design is based on the requirements of projects in 6 different countries. Nonetheless, we realise that some information might still be missing. If you think that's the case, please contact us. 

The first version of the Community module works as folllows:

First, to record an activity that has been conducted, 3 mandatory fields are provided:

  • Activity type contains a list of themes, subjects and types of activities (what);

  • Beneficiary type describes the target group for the selected activity (for who);

  • Mode of engagement describes how knowledge transfer and other interactions are organised (how);

To complete the report of who participated and what was done and achieved, three optional data entry forms are made available: General, Finance, and Natural resources. Please check them out and send us your feedback!

Activating the Community work module
The new Community work module can be activated in two ways:

  1. Go to Group information and edit the Selected tags. Edit the Selected types list and select the Community work option from the ObservationsTypesList (only group owners can do this). Note, for it to work properly, also select and modify the three mandatory fields Activity types, Beneficiaries and Modes of engagement. In addition you can customise the fields Agents and Land-ownership. Again, if any options are missing, contact us so we can include them for you.

  2. Create a new group and (de)select the fields of choice.


Addition of new classes 
Adding new classes (such as a species) to existing categories (such as Mammals) is now even easier and faster than before. Easier: you can load the newly added classes by simply pulling your group list. Faster: new classes can be added, translated, tested and released within a week.

Following request from the field, a number of categories and classes have been added. These are the most important ones:

  • Animal sighting / Animal health (healthy, weak, wounded)

  • Animal sighting / Cause of death / Caught in fence, Starvation and Hit by train

  • Point of Interest / Fire (controlled fire, crown fire, smoke, wild fire)

Tracking types have been expanded with the following options: on Fence inspection, on Perimeter track and on Snare Sweep.

And last but not least: the values of Actions taken can now be customised by the group owner.
 

Tips

  1. Update your Cluey app through the Google Playstore

  2. Refresh your groups list by pulling it. A turning wheel appears. Wait until it disappears again before you continue.

  3. The Community work module is brand-new. If any values that you would expect are missing, we can quite easily add them for you. Just send us a note with a short description. If you can send us a nice icon as well, even better.

  4. For group owners only: check the Selected tags in your Group information for new options per list that have not been described in these release notes.

  5. As of version 3, the observation types that appear when you hit the Add observation button can be customised as well. Go to Group information, Selected tags, and (de)select the options you want in the ObservationTypesList.

Crane Radar Hackathon

The Crane Radar

The Crane Radar is a predictive map that gives birdwatchers a real-time indication of where and when crane birds can be spotted and the direction they are heading.

March of this year, Wageningen University (WUR) and Sensing Clues tested the first online version. Based on observations made by citizen scientists via the platform Waarneming.nl, flocks of cranes appeared on the map. An animation then showed the likely location of these flocks, based on the most recent observations, over 20 years of historic observations, and knowledge about for example their average flying speed.

Challenges

To improve the predictions, the hackathon was aimed at finding ways to incorporate additional environmental factors, such as local weather conditions. In addition we wanted to crack several technical issues of the web application, to allow as many bird enthusiasts as possible to use the crane radar during the upcoming autumn migration.

Results

Based on GPS data provided by the Swedish University of Agricultural Sciences, we were not only able to confirm that wind speed and direction significantly impact the speed and direction of cranes. We also cracked the mathematics behind drift and compensation, two important factors for improving our predictions.

What’s next

In the upcoming months the WUR and Sensing Clues are refining the models and preparing the website. We’ll bring it live in September, about a month before the actual migration starts.

Keep an eye out for our new and improved Crane Radar!

digital twins to foster peaceful Human-wildlife coexistence

Quick-response team in action. Photo by Keith Hellyer

All over the world, human-wildlife coexistence is under pressure. There are many different reasons, but almost all are related to land competition. People tend to use more and more space, but if the natural areas become too small, fragmented or depleted, wildlife is forced to enter human-dominated landscapes to search for food, water, partners and shelter. The consequences are sometimes grave. Crops are eaten and livestock and people attacked. People and wildlife even get killed.

To reduce this problem, many nature conservation organisations engage with local communities to mitigate the damage and establish conditions for peaceful coexistence between people and wildlife. Known solutions include guarding shepherd and dogs, financial schemes to compensate farmers, the funding and placement of fences to keep wildlife at bay, and early warning systems to detect wildlife.

All these measures are very costly and not always effective. Hence, innovations are needed to drive down the costs and boost the effectiveness of existing measures.

The Digital Twin-innovation that we are working on is aimed at boosting the effectiveness of existing measures.This is possible because Digital Twins are sophisticated simulation models that do 3 things:

  1. they predict where (groups of) animals are right now,

  2. the predictions are continuously updated through real-time observations in the field, and

  3. the prediction algorithms automatically become better through time as they learn from every new observation.

Together with the Wageningen University and others, we are developing digital twins for cranes, bears, and elephants (more species will follow!).

Stay tuned if you want to use our Digital Twins to foster peaceful human-wildlife coexistence!

Intro to CAIMAN

Camera traps are very handy tools for nature conservation professionals. Amongst others, they are used to

  • spot rare species,

  • record nocturnal species,

  • assess biodiversity,

  • recognise individuals,

  • conduct a structured census,

  • monitor places of interest, such as water holes or bird nests,

  • detect poachers and other intruders.

Each use case brings its own challenges and implications for the camera setup and the processing of the recorded images. To cater for each of the above use cases, our CAIMAN solution consists of 4 services that can be fine-tuned. That is:

  1. a connection service,

  2. a process configuration service,

  3. a human-in-the-loop service,

  4. and reporting services.

Step 1: Connection Service

If real-time is of the essence, like when you want to intercept poachers, the cameras need to be connected to the internet. If they are, they can stream their images directly to CAIMAN. Through an API, for the technicians amongst us.

Most camera’s though, store their images on a SD-card, which is collected every now and then. After collecting the images from the field, they can be uploaded to the data upload service of Sensing Clues.

Step 2: Process configuration service

In its essence, AI-driven image classification is a statistical exercise. Species are identified with a certain level of probability. As some species are easy to recognise while others are very hard to distinguish from other species, the quality of the AI-model varies per species. 100% confidence is very hard if not impossible to reach. Above 80 to 90% is often more realistic.

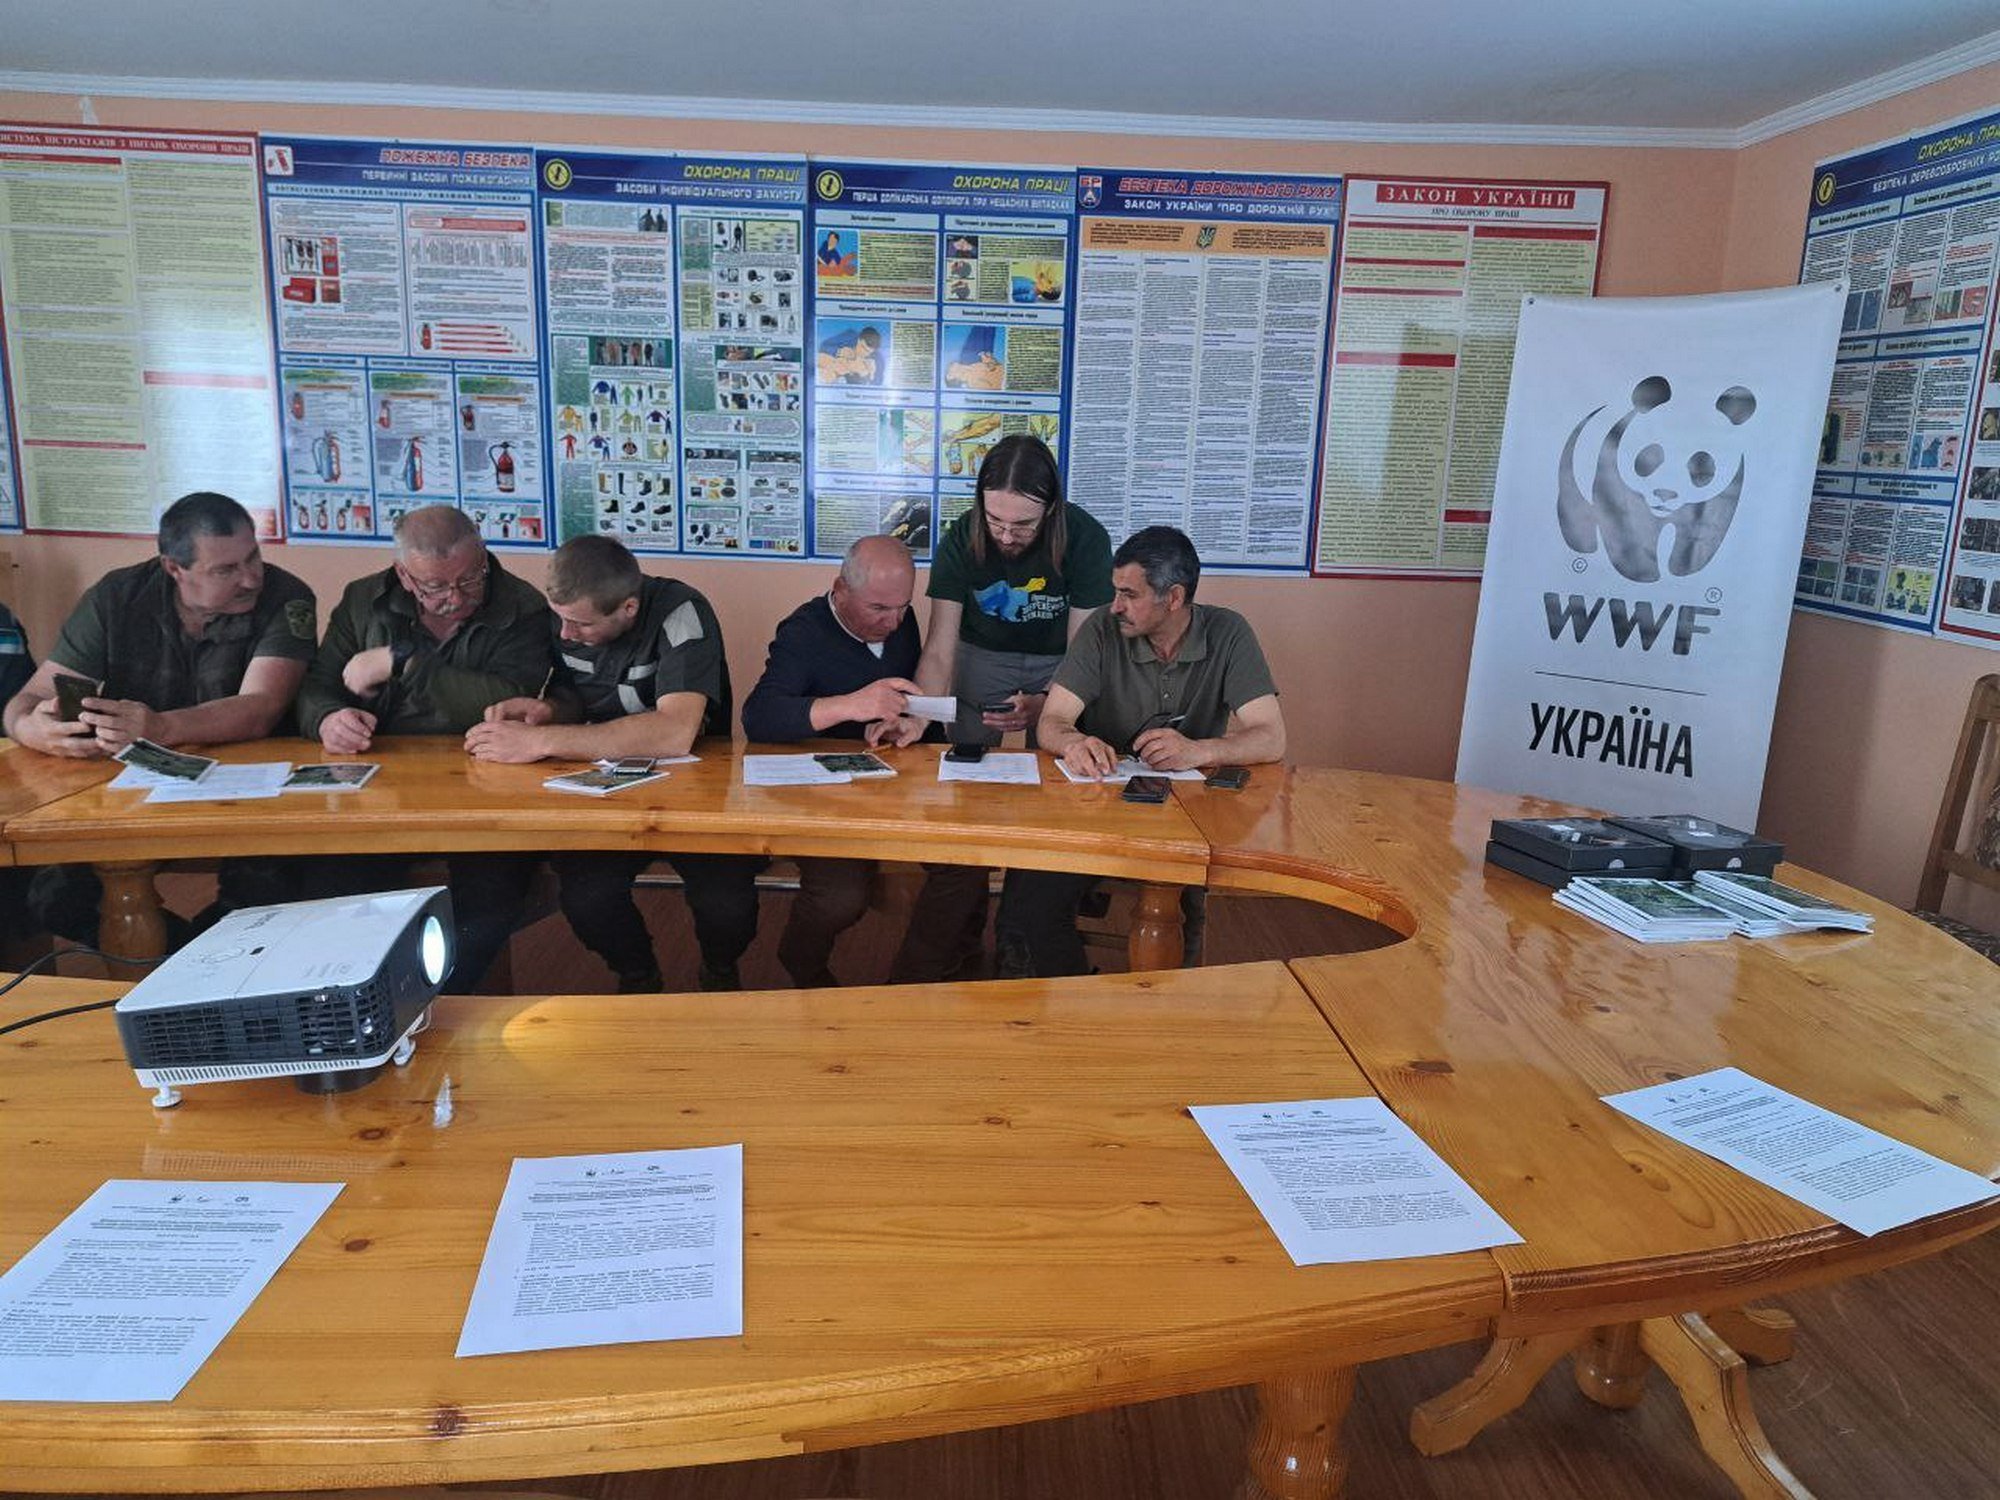
AI models are being trained and made available per geographic region and per use case, as illustrated above. The first solution that we are currently testing is aimed at identifying over 200 species that live in Southern Africa.

To tune the classification process to your needs, minimise mistakes and minimise your time spent behind the computer, thresholds can be set per species. If a species is very important for you, you can set the threshold for automatically accepting the outcome of the algorithm very high. If the species are more abundant and classification mistakes less costly, you can lower the threshold for that species.

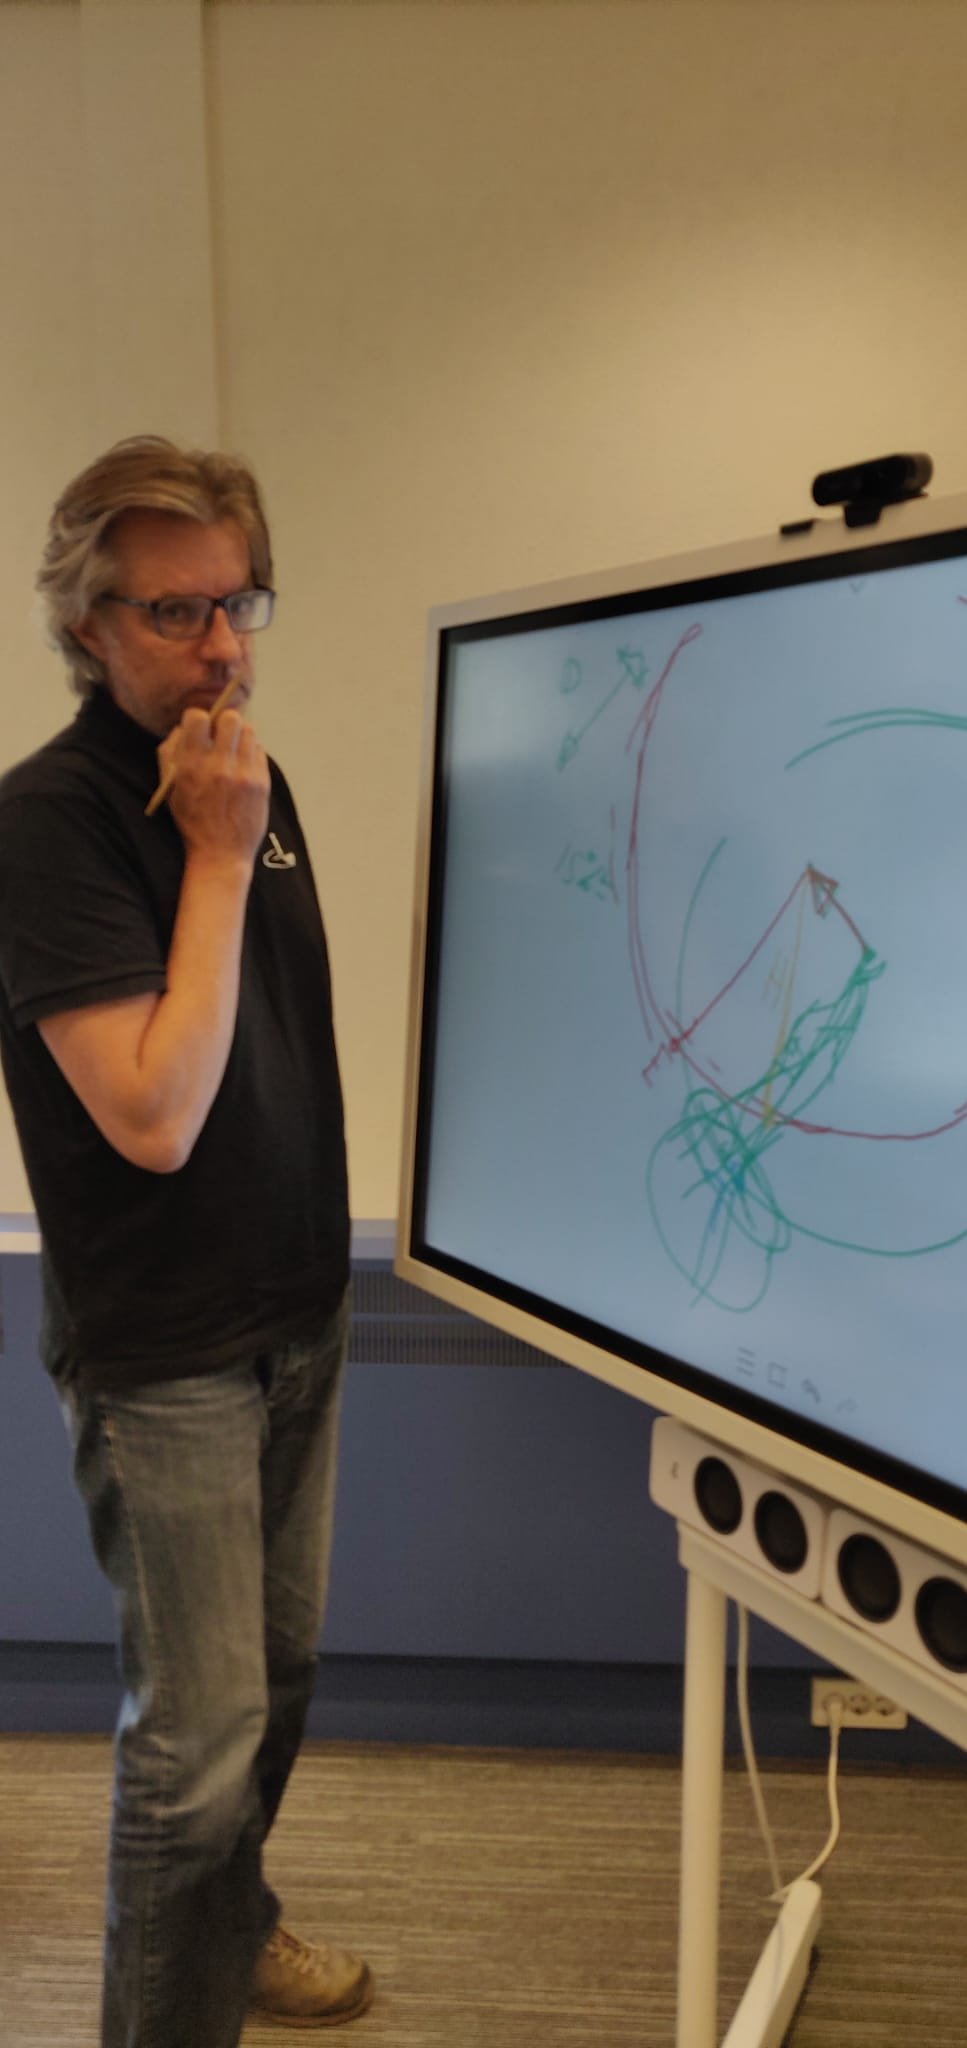
STEP 3: Human-in-the-loop validation service

Classifications with probabilities below the threshold are treated in a separate process. In this process we select images from which can learn most. As soon as you’ve verified the images and confirmed or corrected its class, the AI-model is re-trained. This speeds up the learning process and decreases the number of images that need to be sifted through manually.

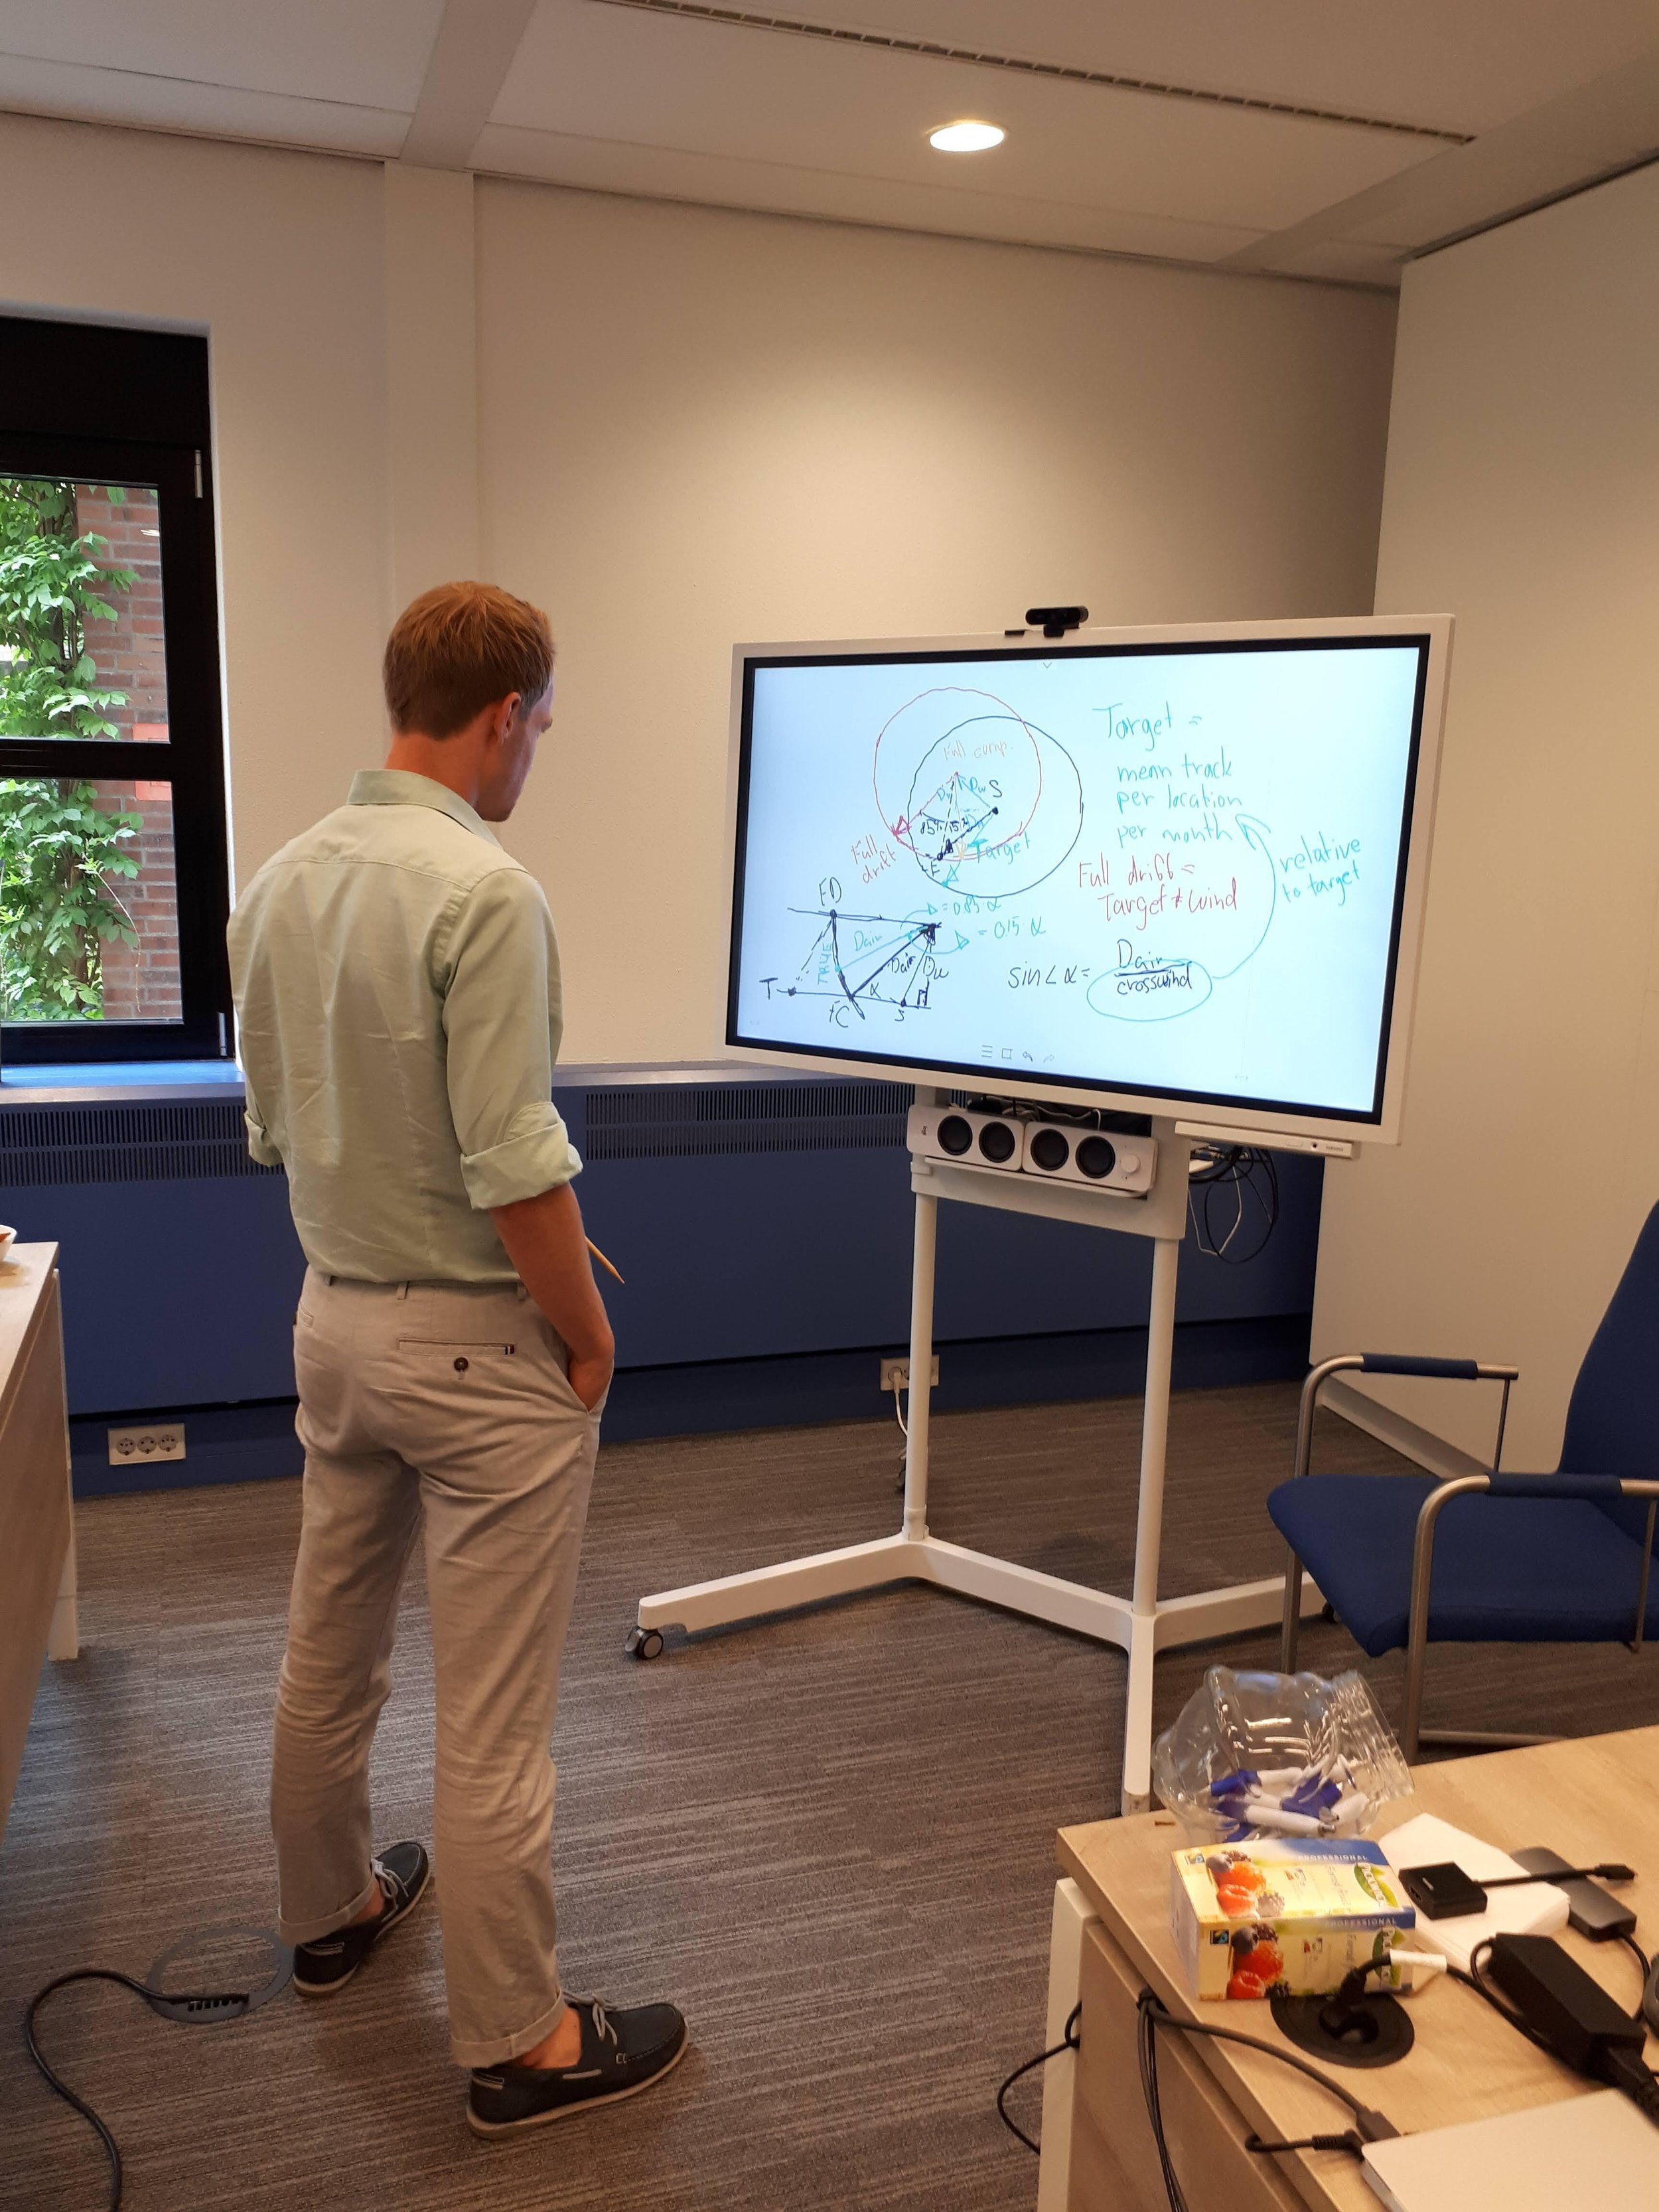
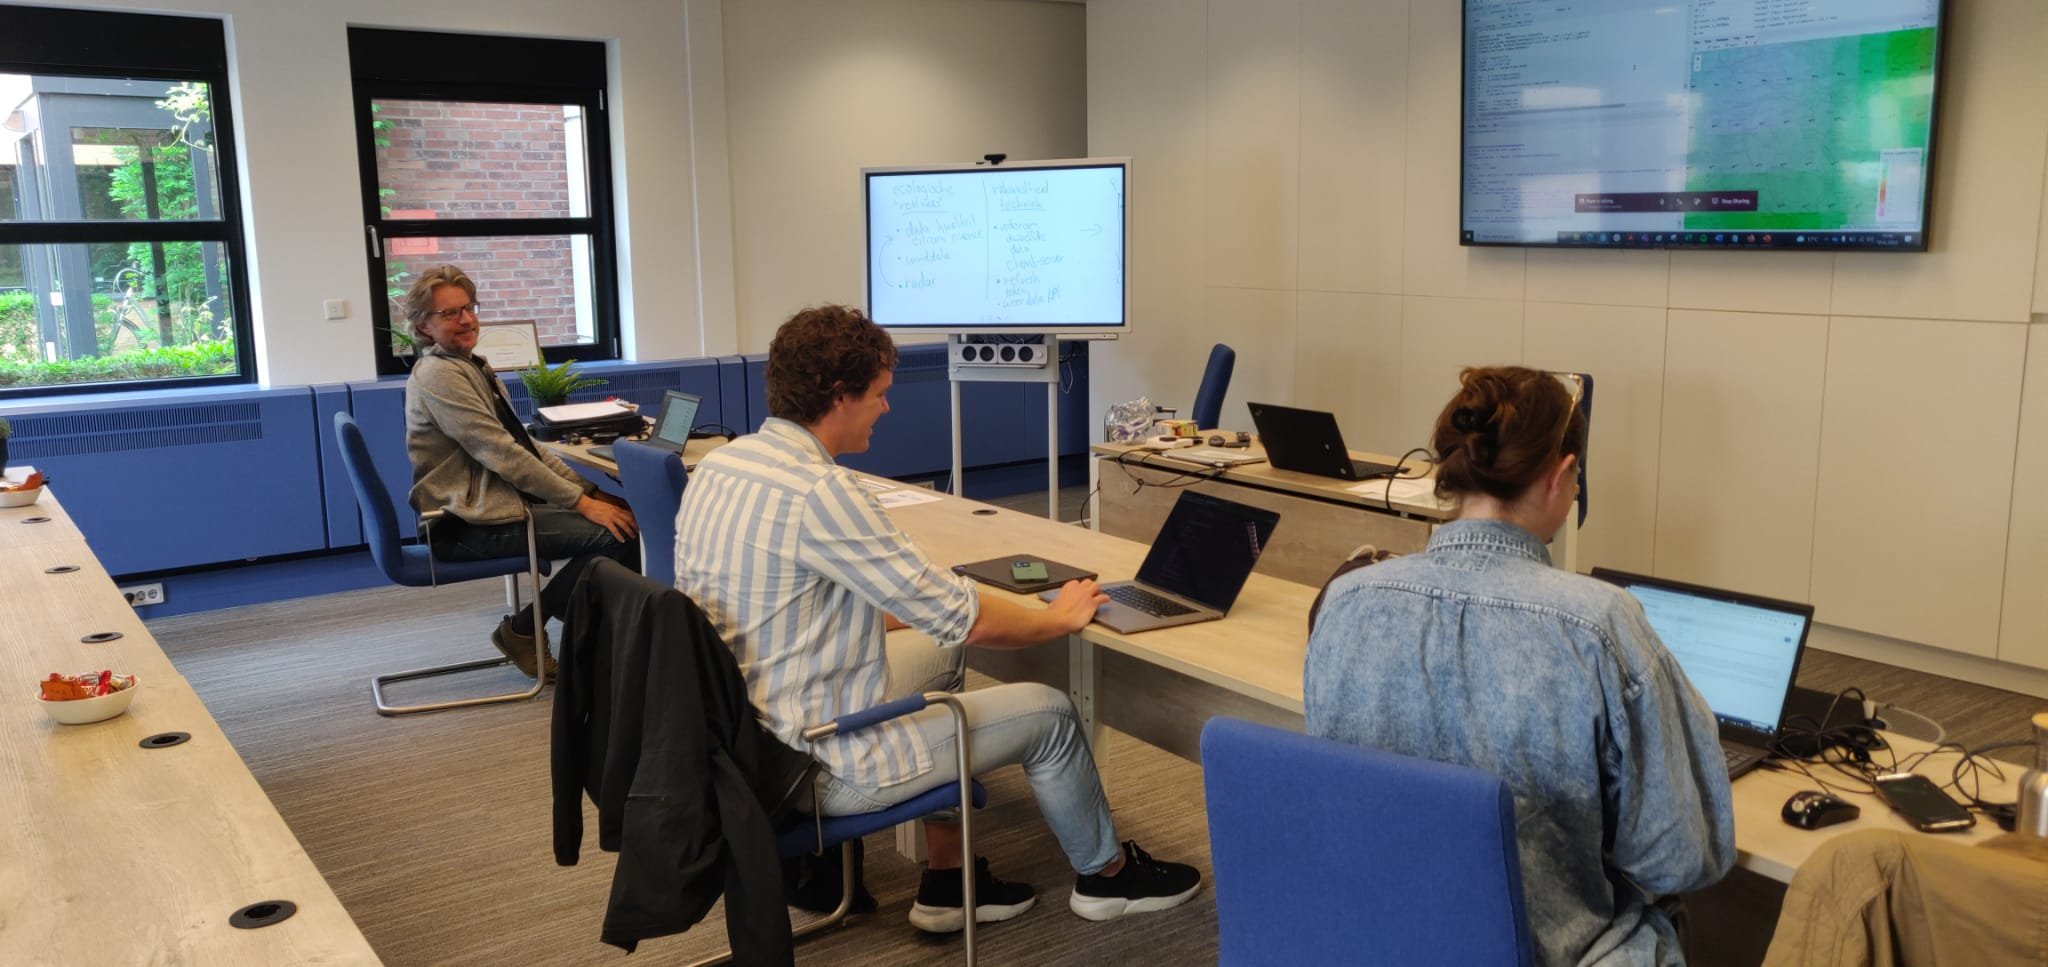
ps. We are still working on the Human-in-the-loop app. The picture above shows an experiment to quickly verify series of images and find oddities, potentially saving you hundreds of hours.

STEP 4: Reporting services

The classified images are stored in the WITS dataplatform. Similar to Cluey-observations, classified cam-trap images are treated as observations. Hence, they are organised in a Group and are made by an Agent (in this case, the name of the camera). And like Cluey-observations, you can visualise and analyse them with Focus, WIldCAT, ArcGIS Online, or any other tool of your preference (e.g. R-Studio, Python, Jupyter Notebooks).